
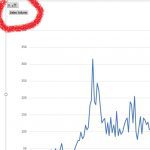
Last week I implemented Pivot Charts for a client with three very large data sets, one of which was 30K rows and the other two being > 10K rows. There was one obvious outlier skewing one of the charts but who knows over time there might be others. What could be an easy simple way to handle this?
I don’t like deleting the actual data because call me old school but the data is the data and it’s better to leave data as the intact truth and find easy ways to include or exclude what you want.
So I added a column to the Table data with a Column Header simply called ‘X’ and the Table cells had a validation dropdown of ‘X’ or nothing.
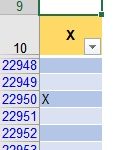

The idea being if the user wants to exclude a certain row’s data because it’s an outlier, this can be easily marked as so in the source data Table data set by entering ‘X’.
Then on the Pivot Table the field also called ‘X’ was chosen in the Filter section of the Pivot Table field list. Then blanks are chosen in that Pivot Table’s filter so any rows marked ‘X’ are excluded.
This can easily be reversed by deleting the ‘X’ entry later or temporarily by changing the filter in the Pivot Table to include all.
OK, the fact my Header was called “X” and the rows to be excluded are marked “X” might be a bit confusing but I didn’t want the heading name in the Filter section to be prominent in the chart’s final appearance. You could just as well make this heading “d”, “[]” or “.” or something else instead.
So not pretending this to be a sophisticated solution for this common problem, but it was simple and worked :).